“Reaction to the new site is excellent. Customer journey clearly improved, and more professional… our ability to understand, see and track the customer journey is enhanced enormously.”
 Heidi McCormack — CEO, Emerald Life
Takeaway
Analytics tells you where people leave. Only talking to them tells you why. Run both and you get an answer neither would have given you.
Brief
Identify the conversion bottlenecks in the customer journey, and turn more of the existing traffic into sales by reducing landing page bounce.
Starting point
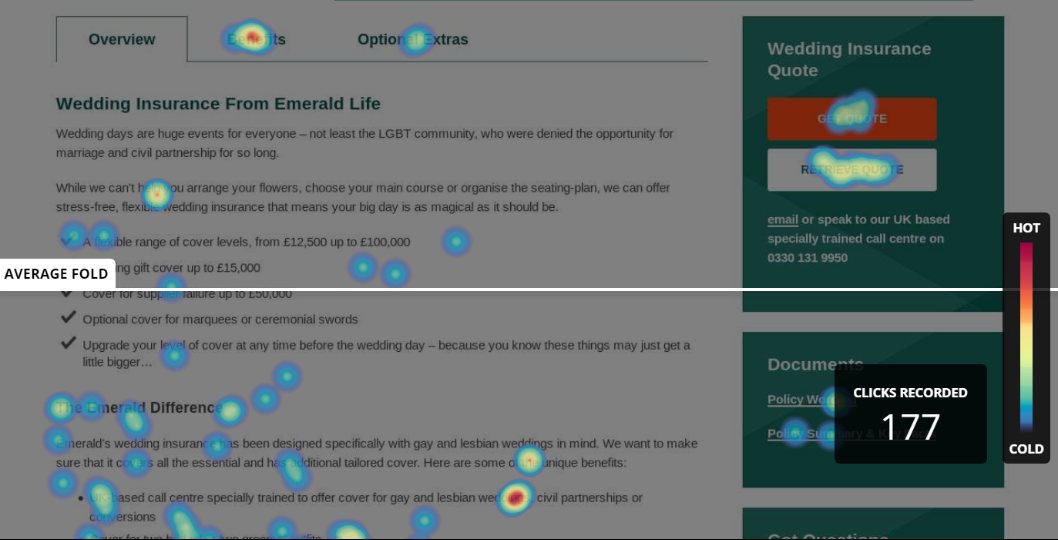
Demand for the service was obvious and the traffic was there. The conversion was not. Buying insurance is a long, multi-step, multi-form job, and nobody could say which step was losing people.
There was a second question underneath: the brand was built for the LGBT community, and Emerald wanted to know whether it could also appeal to a non-LGBT audience without losing what made it distinctive.
Insight
Straight users were not sure they were allowed to apply.
We recruited a deliberate mix of LGBT and non-LGBT participants precisely so the two viewpoints could be compared. The evaluation report found non-LGBT visitors uncertain whether the product was for them — and found the photography of male gay couples was disliked by part of the audience. Neither finding was visible in the analytics. Both were costing conversions.
Interventions
- Ran moderated user testing with 20 recruited participants, capturing 20 think-aloud videos across mobile and desktop, and wrote the evaluation report that informed the business plan
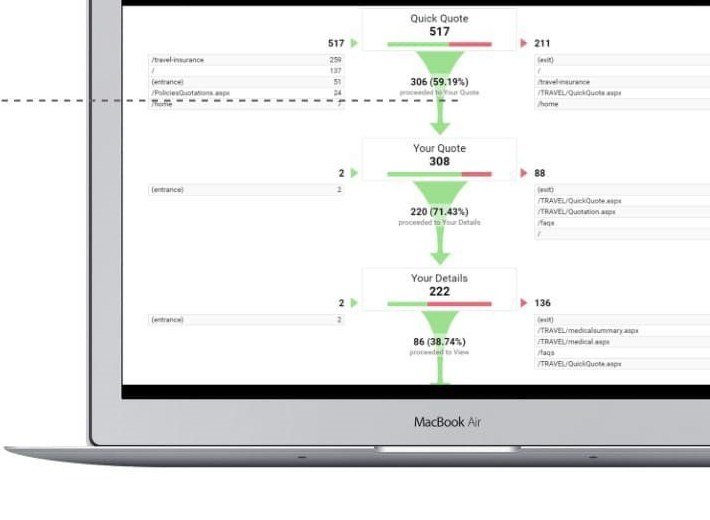
- Reconfigured Google Tag Manager and Google Analytics with goal funnels across all five insurance products, so the quote drop-off points were finally visible
- Added Heap Analytics event tracking to find which individual form fields — dropdowns, text fields — caused friction
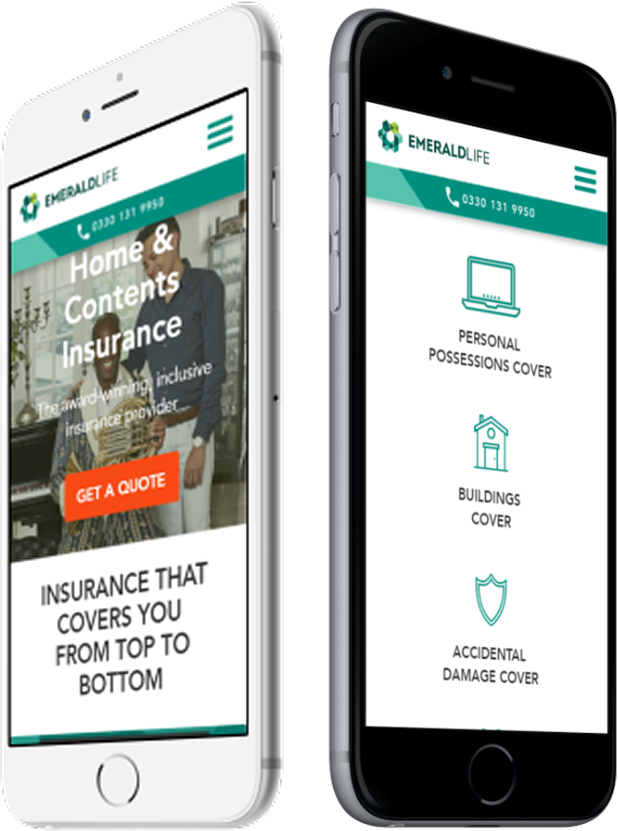
- Redesigned desktop, tablet and mobile: a clear value proposition on the homepage, and product-level propositions on each individual policy page
Evidence